|
GPC/SEC FactsCorrection of some misleading beliefsSome misleading beliefs are prevailing widely among people not involved in GPC/SEC analyses and here are given some facts about the goodness and trueness of the results for polymers. GPC/SECGPC (Gel permeation chromatography) is a type of size exclusion chromatography (SEC), that separates analytes on the basis of size. The technique is often used for the analysis of polymers.GPC separates based on the size or hydrodynamic volume (the radius of gyration). In GPC separation occurs via the use of porous beads packed in a column, where is used an organic solvent as a mobile phase. In these GPC/SEC liquid chromatography (LC) and specially High-performance liquid chromatography (HPLC) methods polymers are dissolved in an appropriate solvent. This topic is well explained in the literature and internet. Weak points: These solvents are many times hot, hazardous and difficult to handle. Dissolution takes time, but the most serious drawback is the fact that that GPC results are not always reliable specially with polyolefins.
GPC/SEC results are not always accurate according to IUPAC Project ReportsGPC/SEC results have relatively good intralaboratory repeatability and very poor apparent interlaboratory reproducibility was observed.IUPAC (International Union of Pure and Applied Chemistry) has managed some round robin tests with international laboratories. In the project 422-4-98 Repeatability and Reproducibility of Molar Mass Values of Selected Commercial Polymers Determined with Size Exclusion Chromatography results for PS were as expected; the repeatability of results was generally very good, usually better than ±5 %. Thus PS is used as a calibration polymer with GPC/SEC systems and column devices. Results for six different type polyethylene samples were poor and hence were not published nor explained in the poster (2001) IUPAC©. They explain that the disagreement in molar mass values reported is caused mainly by different procedures used for sample dissolution and filtration, by differences in eluent flow rate and sample concentration and injected volume, by insufficient separation range, by the poor efficiency of some columns used, as well as by both low number and quality of the PS calibration standards. They believe that sample portions with the highest molar mass could be degraded during the experiment. Published results are found presently in the project 2005-011-3-400, PHASE 1: IUPAC SEC/GEC Round Robin Project Report, Repeatability and Reproducibility of Sample Preparation and Analysis in High-Temperature SEC (2010) IUPAC©. For LDPE they found Mw differs roughly from 100000g/mol up to 300000g/mol taking values from the chart below. Respectively polydispersity MwR values (PDI) from 6 up to 12in the case some most distant values are excluded from results. This results in 33% error on their average value. Respectively absolute values differ two or three times from each other. Their original plan was also to test HDPE, but there can be still higher differences in MWDs due to influence of LCBs. Thus instead they tested PP and LLDPE, where the results were in the line of the first LDPE results shown here. The complete IUPAC© report (2010) is found here. 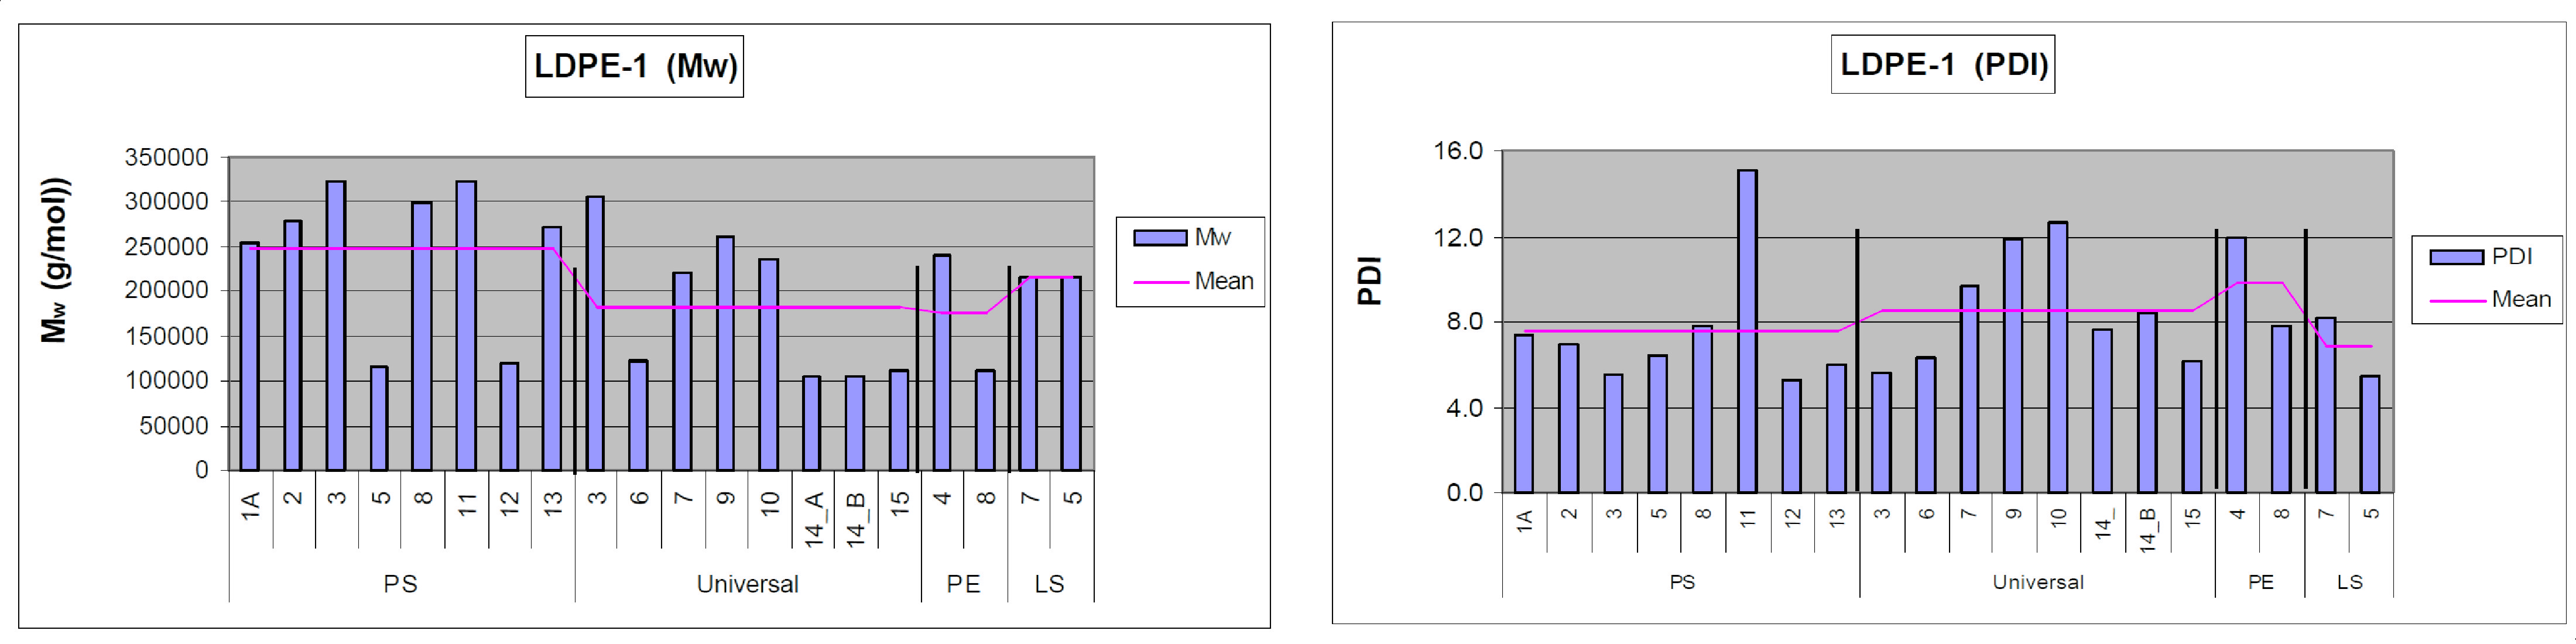
Results for Mw and MwR (PDI) values by IUPAC GPC/SEC Round Robin Project Report. In the IUPAC Round Robin Project Report (2010) they found the differences of the results from separate laboratories can be even three times for average Mw and polydispersity MwR (PDI) values on sight on figures.* Click figure to zoom it.* IUPAC encourages republication or the reproduction of any Recommendation or Technical Report or its storage and/or dissemination by electronic means. No formal IUPAC permission is needed on condition that an acknowledgment, with full reference to the source along with the use of the copyright symbol ©, the name of IUPAC, and the year of publication are prominently visible.Therefore the use of average Mw values in the accurate form 123456g/mol is misleading for the accuracy of value. More applicable would be 123kg/mol or 123000g/mol.
GPC/SEC vs. RheoPowerThe huge differences of GPC/SEC results for PE on published papers and MWDs delivered from various polymerization plants compared with their viscoelastic data have been bottle neck for RheoPower progress. We have had a wrong standpoint and we have trusted too much on GPC results in particularity with PE polymers.In our published paper Part II we found that the average error between the measured viscosity data and the model was %RMSE = 0.0009% for LDPE, which is more than 50 times smaller than that for any other published model. The average Mw was 235000 g/mol (with a deviation of 2.3%) and Mw/Mn = 14.1 for all computations. The problem with comparing RheoPower MWD results is the fact that to find right Mf and Hf factors for new polymer type depends very much on the used laboratory and their GPC/SEC data. In the software databases are found some mean values. That is why melt calibration for Mf and Hf factors needs to be made locally with their used GPC/SEC laboratory. On the other hand in RheoPower system is suggested to use more RED (Rheologically Effective Distribution), which is the right viscoelastic fingerprint of polymer properties. However viscoelastic data for RheoPower analyzes from oscillation rheometers manufactured by various companies do not differ much. Authors opinion: Not only we before, but many other researchers and developers have made unsuccessfully tremendous amount of work during decades trying to simulate results for PE developed by different GPC/SEC laboratories and finding general model related viscoelastic measurements before RheoPower age. |
|


